Data Point
Cox Automotive Analysis: Ford’s Q4 2020 U.S. Market Performance
Wednesday February 3, 2021
Article Highlights
- Ford sales underperformed market, down 10%.
- Ford brand incentives were cut; Lincoln’s ramped up.
- Average Transaction Prices rise 4% to $46,575.
Ford reports fourth-quarter and full-year 2020 financial results Thursday, Feb. 4, after the stock market closes.
Analysts expect Ford to report a small loss, though they would not be surprised to see the automaker outperform forecasts. Ford already has warned about one-time expenses reflected in the quarter, including a recall for potentially defective Takata airbags with a cost of $610 million and a $1.5 billion charge related to its pension plans.
Here are key data points from Cox Automotive on Ford’s fourth-quarter performance in the U.S. market, where the company derives the bulk of its profits.
Sales and market share
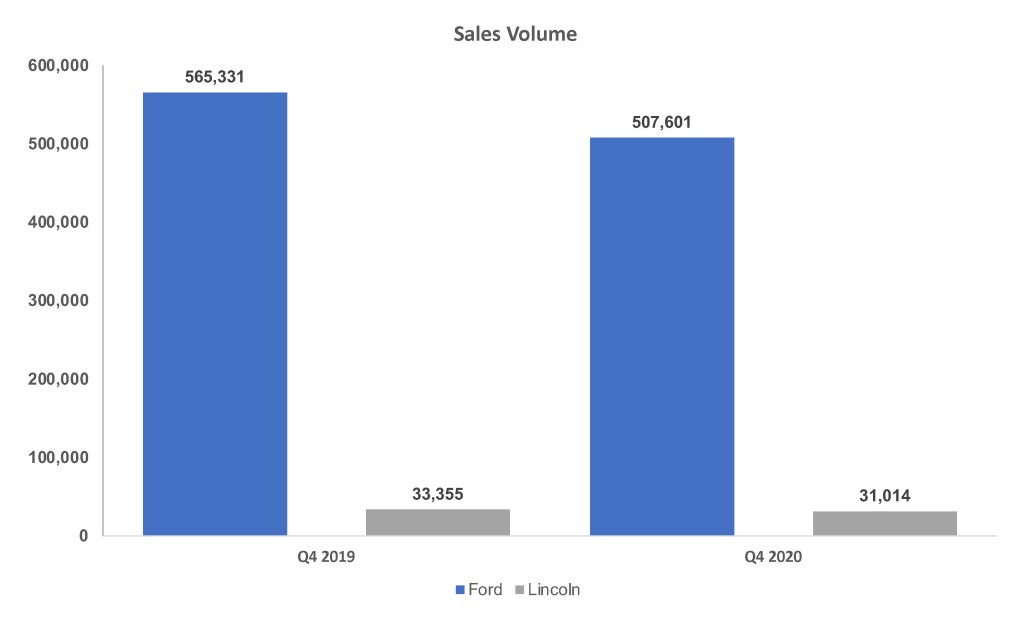
Ford’s Q4 sales, including Ford and Lincoln brand vehicles, dropped 10% to 538,615 units, underperforming the industry, which was down only 2%, according to Cox Automotive data.
Ford’s Q4 market share closed at 12.86%, plummeting from 14.90% in the third quarter when Ford outperformed the market. It compares with 13.97% in Q4 2019. The quarter marked the first time that Ford’s market share fell below 13% in Q4 in at least five years.
Ford brand sales dropped 10% to 507,601 units in Q4, putting market share at 12.12%, down from 13.19% a year ago and 14.11% in the third quarter.
Ford Explorer had a stand-out performance with sales up nearly 29%. The full-size Expedition SUV was up nearly 8%, and the Transit was up 3%. The rest of Ford’s models had lower sales than a year ago. The F-Series was down 15%. Ford began launching the redesigned F-Series in the quarter, holding back inventory for extra quality inspections, the company said. Ranger pickup sales were down 18%. Ford sold three of the just-launched Mustang Mach-E units in the quarter. Some of those have been held back as well for quality inspections.
Lincoln sales were off 7% to 31,014 units. Lincoln’s share dipped to .74%, down from .78% but up from .73% in the third quarter. It was still the second highest fourth quarter market share for Lincoln in the past five years.
Aviator sales were up 13%, and Corsair sales rose 7%. The rest of Lincoln’s models had sales drops.
Incentives
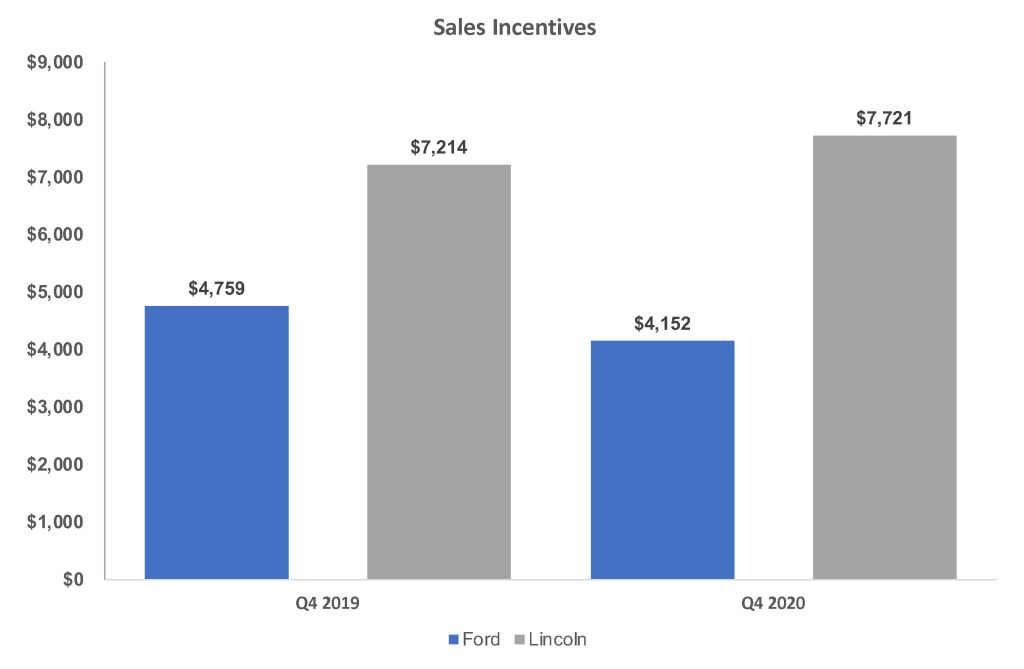
Ford, in total, trimmed overall incentives from a year ago and the previous quarter. Ford’s incentives averaged $4,358 per vehicle, down 11% from a year ago, according to Kelley Blue Book. Q4 incentives were down slightly from Q3’s $4,410 average.
The Ford brand cut incentives by 13% from a year ago to an average of $4,152, likely due to the launch of the new F-150 which doesn’t carry much in the way of incentives. Ford brand’s incentives averaged $4,759 per vehicle a year ago and $4,249 from Q3.
Lincoln pumped up the incentives to an average of $7,721 per vehicle, its highest level by at least $400 for the last five fourth quarters. The incentives were up 7% from Q4 a year ago and from $7,458 per vehicle in Q3.
Average Transaction Prices
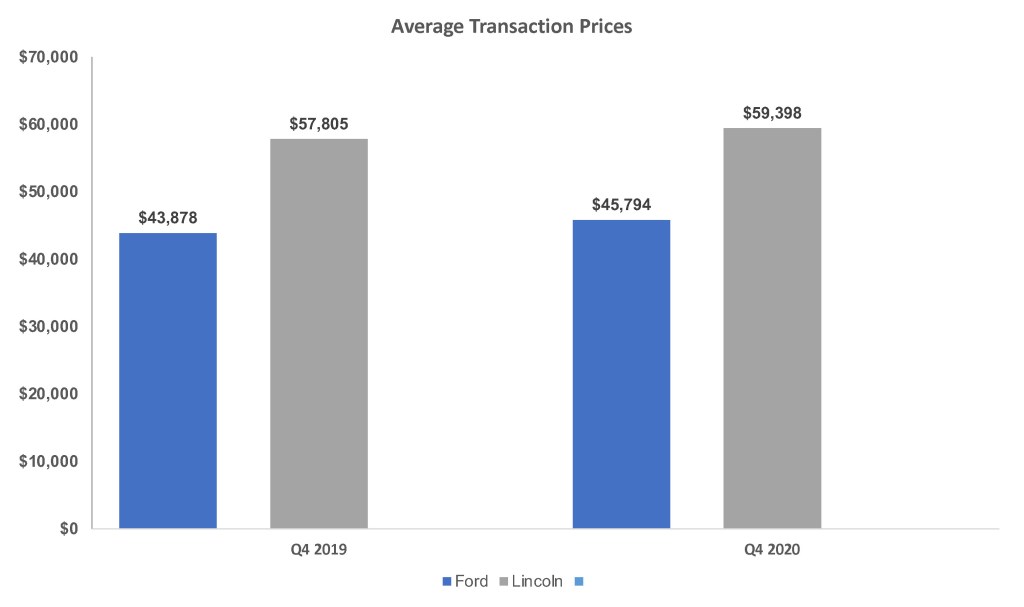
Ford’s overall average transaction prices (ATP) rose 4% to $46,575, the highest fourth-quarter level in five years.

Ford brand’s ATP rose 4% to $45,794. Lincoln ATPs rose 3% to $59,398, outpacing fourth-quarter levels in the past five years by as much as $1,600.


