Data Point
Wholesale Used-Vehicle Prices In November Down 14.2% Year Over Year
Wednesday December 7, 2022
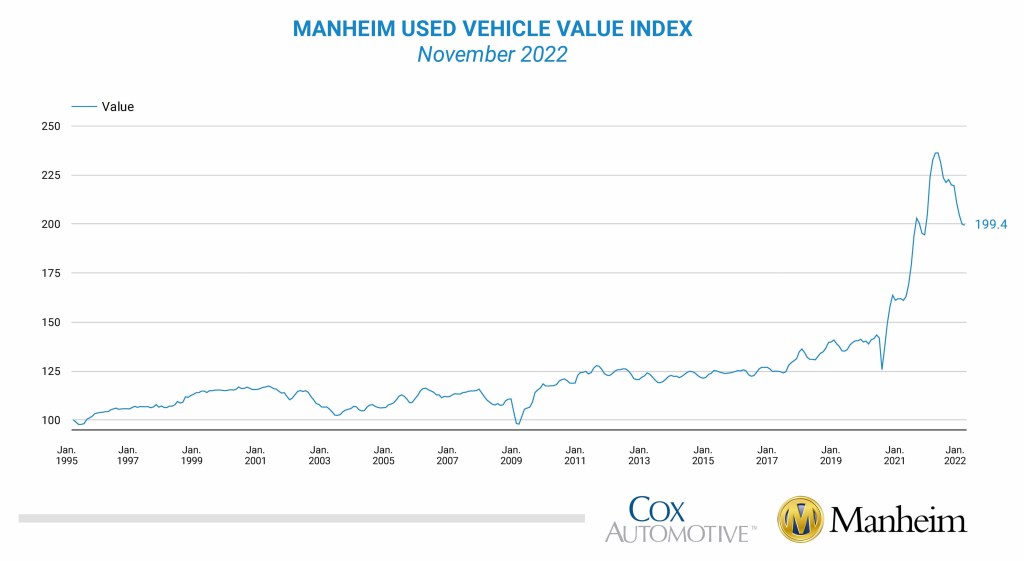
Wholesale used-vehicle prices (on a mix, mileage, and seasonally adjusted basis) decreased 0.3% in November from October. The Manheim Used Vehicle Value Index (MUVVI) declined to 199.4, down 14.2% from a year ago. This is the first time the MUVVI has dropped below 200.0 since August 2021. The non-adjusted price change in November was a decline of 1.6% compared to October, moving the unadjusted average price down 12.4% year over year.
In November, Manheim Market Report (MMR) values saw larger-than-normal declines, culminating in a 2.2% total decline in the Three-Year-Old Index over the last four weeks. Over the month of November, daily MMR Retention, which is the average difference in price relative to current MMR, averaged 98.4%, meaning market prices were below MMR values. The average daily sales conversion rate decreased to 49.8%, which was below normal for the time of year. For example, the daily sales conversion rate averaged 50.8% in November 2019. The lower conversion rate indicated that the month saw buyers with more bargaining power than what is typically seen for this time of year.
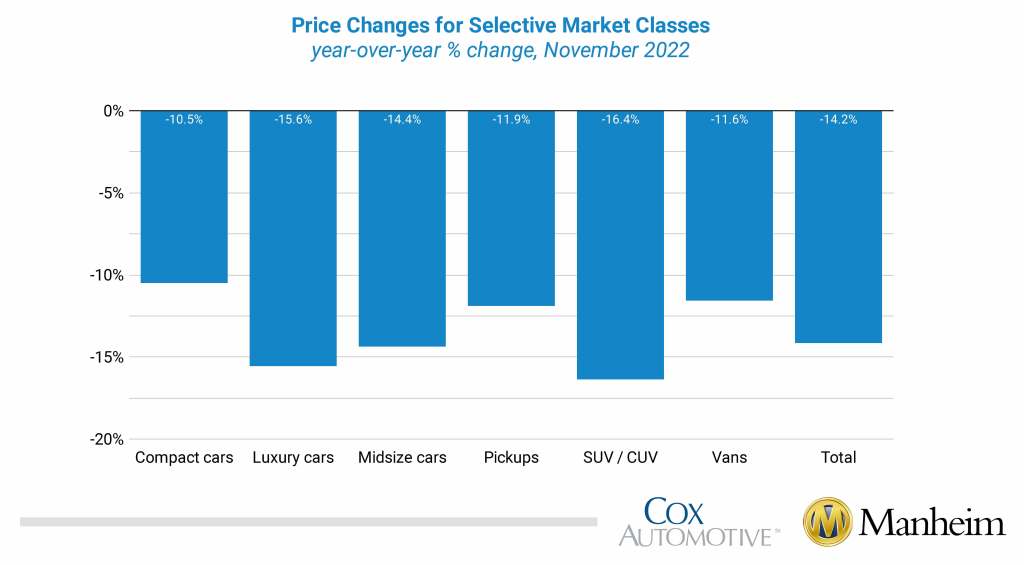
All eight major market segments again saw seasonally adjusted prices that were lower year over year in November. Compact cars had the smallest decline at 10.5%, followed by vans and sports cars, both at 11.6%, and pickups at 11.9%. The other four segments’ prices were lower than the industry. Compared to October, six of eight major segments’ performances were down. Full-size cars lost the most at 6.4%, followed by midsize cars at 1.1%. Four other segments lost under 1%. Sports cars were up by 1.2% and pickups gained 0.9%.
Used Retail Sales Estimates Declined in November
Leveraging a same-store set of dealerships selected to represent the country from Dealertrack, we initially estimate that used retail sales declined 1% in November from October and that used retail sales were down 10% year over year. Compared to November 2019, sales were down 22%, which was an improvement from October. Credit transactions heavily influence the same-store data series, and growth in cash purchase activity is likely causing the estimates to decline more than actual market sales.
Using estimates of used retail days’ supply based on vAuto data, November ended at 47 days’ supply, down from 53 days at the end of October but higher than how November 2021 ended at 44 days. Leveraging Manheim sales and inventory data, wholesale supply is estimated to have ended November at 29 days, higher than how November 2021 ended at 24 days but unchanged from the end of October.
November’s total new-light-vehicle sales were up 10.4% year over year, with one more selling day than in November 2021. By volume, November new-vehicle sales were down 4.2% from October. The November sales pace, or seasonally adjusted annual rate (SAAR), came in at 14.1 million, a 7.9% increase from last year’s 13.1 million but down 6.5% from October’s 15.1 million pace.
Combined sales into large rental, commercial, and government fleets were up 55% year over year in November. Sales into rental fleets were up 127% year over year, sales into commercial fleets were up 29%, and sales into government fleets were up 15%. Including an estimate for fleet deliveries into dealer and manufacturer channels, the remaining retail sales were estimated to be up 4.8%, leading to an estimated retail SAAR of 12.5 million, down 0.3 million from last month’s pace, or 2.3%, but up 0.9 million from last year, or 7.6%. The fleet share of 15.7% was up 1.6% from last month and was up 4.5% from last year.
Rental Risk Prices Mixed in November
The average price for rental risk units sold at auction in November was up 0.6% year over year. Rental risk prices were down 0.4% compared to October. Average mileage for rental risk units in November (at 54,000 miles) was down 28.5% compared to a year ago and down 4.3% from October.
Measures of Consumer Confidence Were Mixed in November
The Conference Board Consumer Confidence Index® declined 2% in November, and the October index was also revised down. Most of the index decline was driven by a 3.2% decline in views of future expectations. Plans to purchase a vehicle in the next six months declined, erasing the improvement in October, but remained up year over year. The confidence index has not declined as much this year as the sentiment index from the University of Michigan, but that series also declined in November. The Michigan index declined 5%, driven primarily by the views of current conditions declining 10%, while the expectations index was down only 1%. Consumers’ views of buying conditions for vehicles declined modestly but remain better than earlier this summer. The daily index of consumer sentiment from Morning Consult measured improving sentiment in November, as that index was up 2.6% for the month. Sentiment improved in November as we got past the mid-term elections and while the price of gasoline fell to its lowest level since February. The national average price was $3.47 per gallon for unleaded gas at the end of November, according to AAA.
The complete suite of monthly MUVVI data for December will be released on Jan. 9, 2023, the fifth business day of the month, as regularly scheduled. Register to attend the next quarterly call on Monday, Jan. 9, 2023, at 11 a.m. EST.
For questions or to request data, please email manheim.data@coxautoinc.com. If you want regular updates about the Manheim Used Vehicle Value Index, as well as direct invitations to the quarterly call sent to you, please sign up for our Cox Automotive newsletter and select Manheim Used Vehicle Value Index quarterly calls.


