
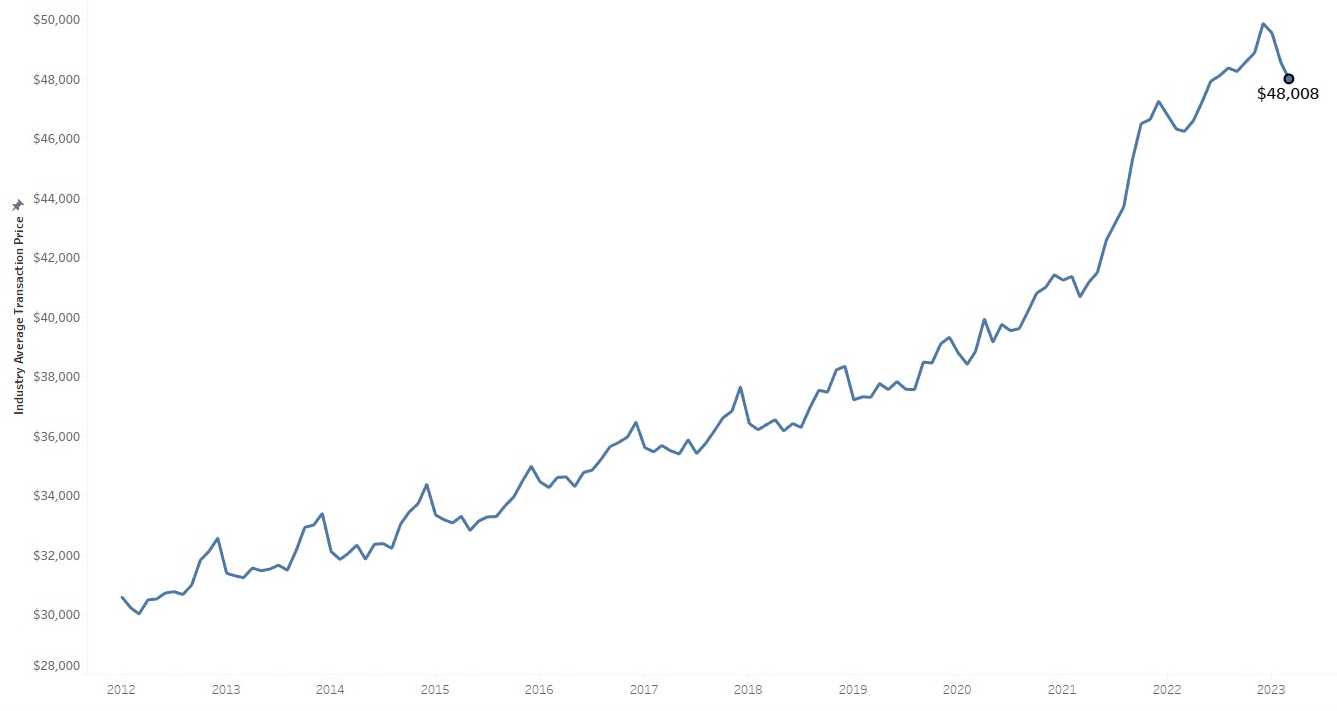
ATLANTA, April 11, 2023 – A nearly two-year trend was broken in March 2023 when the average price Americans paid for a new vehicle fell below the manufacturer’s suggested retail price (MSRP) for the first time in 20 months, according to data released today by Kelley Blue Book, a Cox Automotive company. The average transaction price (ATP) of a new vehicle in the United States declined in March 2023 to $48,008, a month-over-month decrease of 1.1% ($550) from a downwardly revised February reading of $48,558. March 2023 transaction prices remained up 3.8% ($1,784) compared to year-ago levels. Meanwhile, auto manufacturers’ incentive spend rose to the highest level in a year, reaching 3.2% of the ATP in March 2023, averaging $1,516.
According to Kelley Blue Book calculations, new-vehicle ATPs have been above the average MSRP (also known as the sticker price) for 20 months, but last month brought long-awaited good news for buyers as that trend finally changed. In March 2023, transaction prices continued to trend downward, and the average price consumers paid fell to $171 below the average sticker. For comparison, in March 2022, the average ATP was nearly $1,000 over MSRP. Sales volumes were up month over month by 20% and up 8% year over year in March 2023, thanks partly to improved supply, a better mix of lower-priced models and strong fleet sales.
NEW-VEHICLE AVERAGE TRANSACTION PRICE
“The latest transaction data from March reveals new-vehicle prices continued a downward trend through the first quarter of 2023,” said Rebecca Rydzewski, research manager of economic and industry insights for Cox Automotive. “Both luxury and non-luxury prices were down month over month. We’ve been anticipating transaction price declines as inventory has steadily improved and choice has expanded. More vehicles on dealer lots – and on their competitors’ lots – means dealers simply don’t have the pricing power they did six months ago.”
Average Prices for Non-Luxury Cars Decline
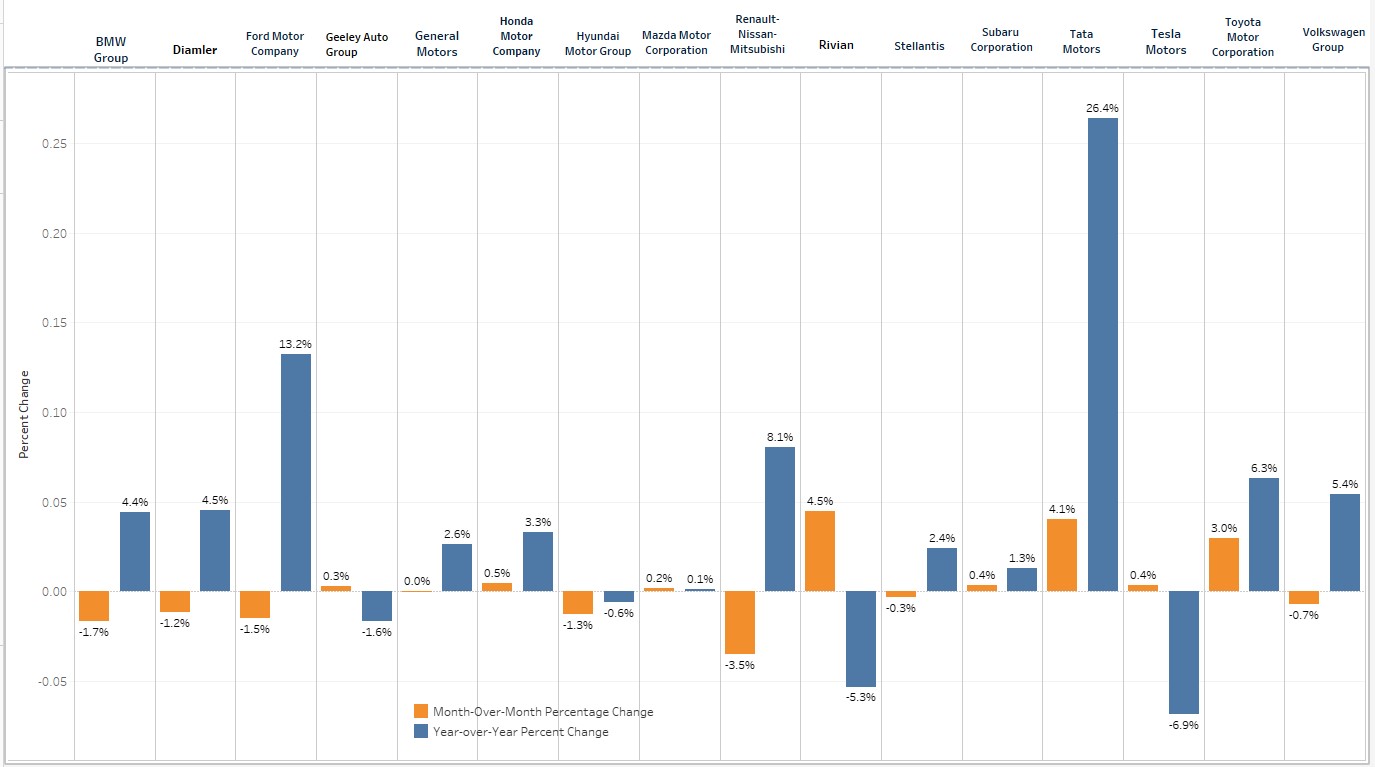
The average price paid for a new non-luxury vehicle in March 2023 was $44,182, a decline of $505 compared to February 2023. Most non-luxury brands – including Chevrolet, Chrysler, Dodge, Ford, Hyundai, Kia, Nissan, and Volkswagen – saw ATP declines between 0.2% to 3.8% month over month in March. This correlates with higher incentives helping to push prices down. Honda and Kia showed the most price strength in the non-luxury market, transacting between 3% and 6% over sticker price in March.
Luxury Share Stays High While Average Prices Fall Slightly in March
Strong luxury vehicle sales have been a primary reason for overall elevated new-vehicle prices. This trend continued in March 2023 when luxury vehicle share hit 18.2% of total sales, down slightly from a high of 19.3% in January 2023. The high share of luxury sales continues to push overall industry ATP higher, even though the luxury ATP has declined month over month. For comparison, in March 2018, the luxury share was 14.0% of the market. Two luxury brands now have average transaction prices over $100,000 – Land Rover and Porsche. (Note: Kelley Blue Book data presented here does not include exotic brands such as Ferrari and Rolls Royce.)
Buyers continue to pay over MSRP for new luxury vehicles. In March 2023, the average luxury buyer paid $65,202 for a new vehicle, down just $9 from February 2023. Luxury vehicle ATPs were a mixed bag in March, with entry-level luxury cars, high-end luxury cars, luxury compact SUVs, luxury mid-size SUVs and luxury subcompact SUVs all showing price declines between 0.5% and 1.4%. Luxury cars and luxury full-size SUVs saw price increases between 0.8% and 1.6%.
PRICE CHANGE PERCENTAGE BY AUTOMAKER
Electric Vehicle Prices Increased Slightly in March, Bucking the Downward Trend
The average price paid for a new EV increased by $313 (up 0.5%) in March 2023 compared to February 2023. The average new EV sold for $58,940 in March, according to Kelley Blue Book estimates, which still is well above the industry average. New EV pricing peaked in 2022, decreasing steadily since Q3 of last year.
Still, March’s upward movement of EV ATP was a bit of a surprise since Tesla, the automaker with the largest share of EV sales, has cut prices three times in recent months. However, EV sales from Mercedes, Rivian, Lucid and other brands have increased at the same time, offsetting lower-priced Tesla products.
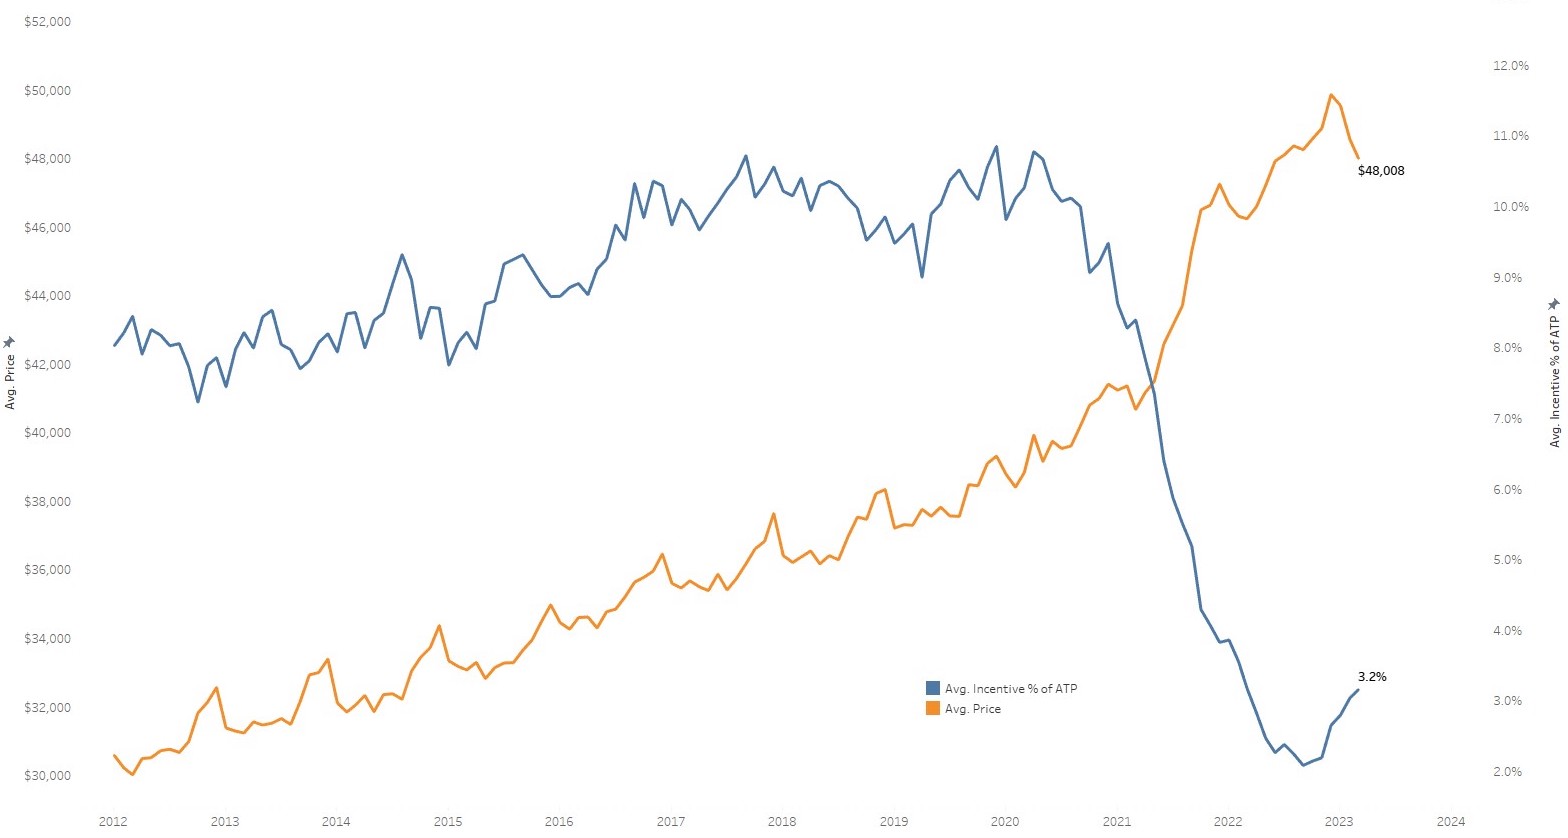
Auto Incentives Offered by Manufacturers Remain at Historically Low Levels but Are Trending Upward
Incentives averaged $1,516, increasing to 3.2% of the average transaction price compared to 3.0% in February 2023. However, incentive spend remains at a historically low level. For comparison, in March 2021, Kelley Blue Book estimates incentives averaged 8.4% of ATP. Luxury cars had the highest incentives in March 2023 at 6.7% of ATP. Meanwhile, vans had the lowest incentives at less than 1% of ATP.
INDUSTRY AVERAGE TRANSACTION PRICE VERSUS INDUSTRY AVERAGE INCENTIVE SPEND AS % OF ATP
“Incentives and inventory tend to move in tandem – when one moves up, so does the other,” said Rydzewski. “Right now, in-market consumers are finding more inventory, more choice, and dealers more willing to deal, at least with some brands. Yet, even as deals improve, unfortunately, auto loan rates remain very high, ultimately making new-vehicle affordability an issue for many households.”

